Let’s dive deeper into report generation! Learn how Giatec 360™‘s reports help you make better decisions faster on the jobsite. For an introduction to Giatec 360, click to read Part 1 of this blog.
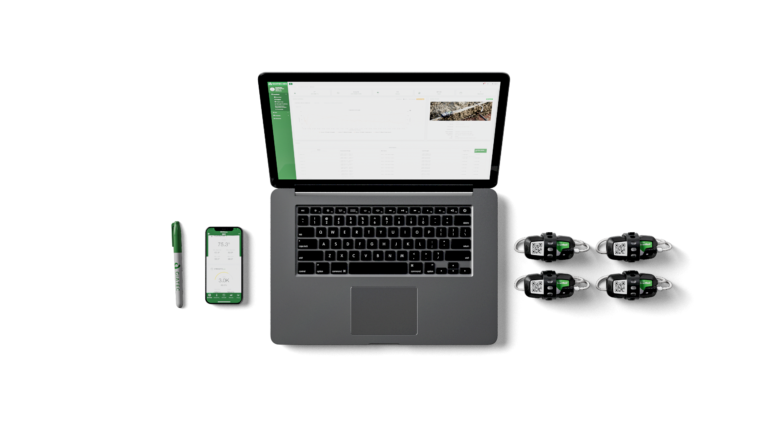
Giatec 360 – An Overview
Some of the key features are as listed as follows:
- Temperature Differential Analysis
- Generating Full PDF/CSV Reports
- Customizing the reports as per user’s preferences which includes:
- Generating reports for a specific data range
- Selected data generation – such as cable/body temperature or strength
- Threshold selections
- Combined report generation containing ‘n’ number of sensors
- Combined report generation with specific settings assigned for individual sensors
- Concrete Strength Prediction
- Procore Integration
- Managing Maturity Calibration
- Managing Thresholds
Temperature Differential Analysis
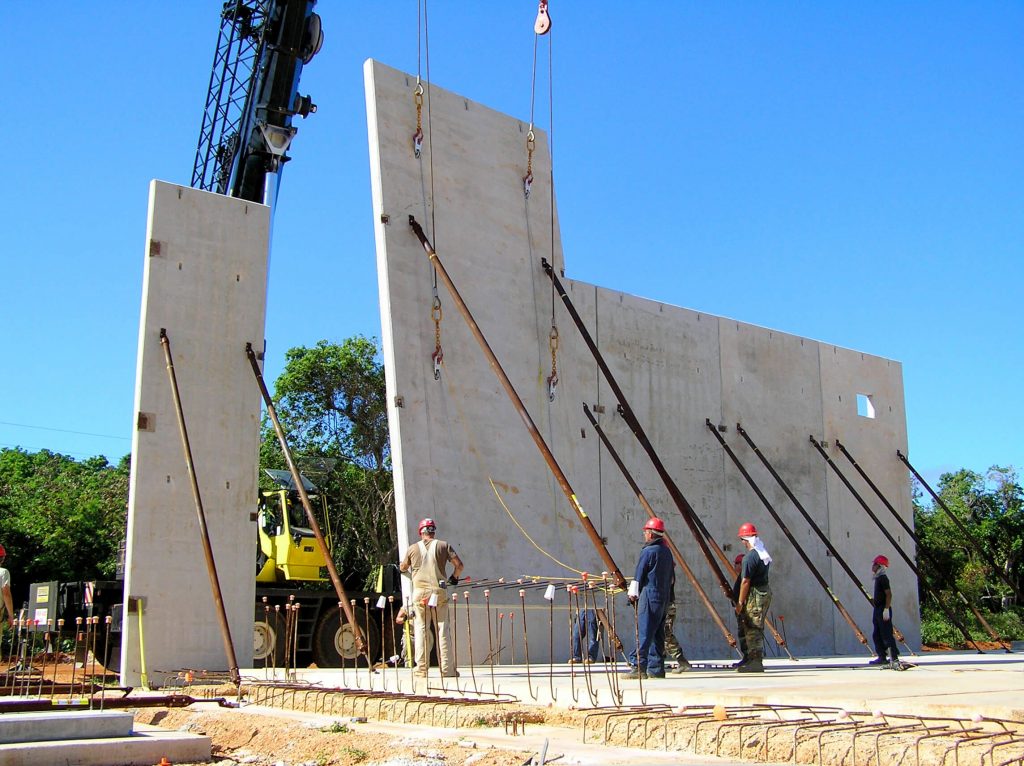
In mass concrete applications, identifying the temperature differential of the concrete pour is critical. Temperature differential, as the name implies, is the difference between two varying conditions in terms of their temperature. Making sure the concrete poured does not exceed a certain temperature difference [say 20 ℃ (36℉)] is certainly one of the more difficult tasks that require a lot of work. The ‘Temperature Differential Analysis’ feature on 360 makes this process easier than ever. The SmartRock sensors installed into the concrete surface monitor the real-time temperature. Analyze the temperature difference of an individual SmartRock sensor or the temperature difference among ‘n’ number of sensors installed in the concrete pour in just a few seconds! This is possible with Giatec’s 360 web-access platform through some simple steps.
What is fascinating about the ‘Temperature Differential Analysis’ is that the analysis can be performed with a custom start date. The thresholds can be created as many times as the user wants and assigned to individual sensors or perform separate analyses for different thresholds created.
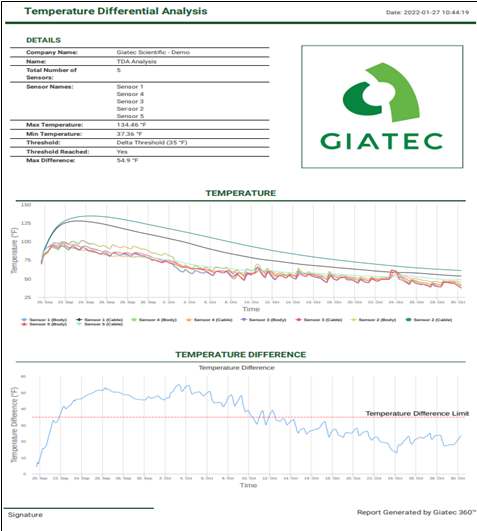
The analysis performed generates a chart containing the temperature difference observed with reference to the gradient limit. This makes it visually engaging in terms of interpreting the analysis for the end-user. Furthermore, the analysis performed can be generated as a report in both Excel and PDF formats using Giatec 360. The final PDF will not just contain the temperature difference chart but also the temperature data for each sensor with a company logo displayed on the top.
Report Customization With Giatec 360
Data Range
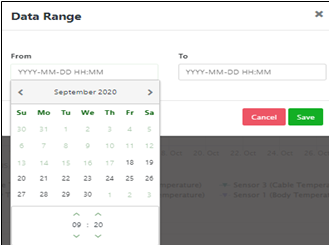
One of the features of 360 is the ability to generate reports over a definite time period. The data monitored by the sensors may sometimes need to be filtered to specific start and end dates. Having the opportunity to customize the report up to a user’s preference further increases the clarity of the data monitored.
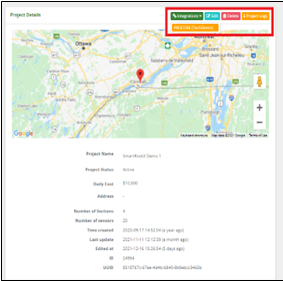
The ‘Data Range’ feature introduced on 360 allows users to generate a report over a specific timeline. Using this function, a user can select → from (date, time) and → to (date, time), as displayed in the image, and generate a report accordingly.
Combined Chart
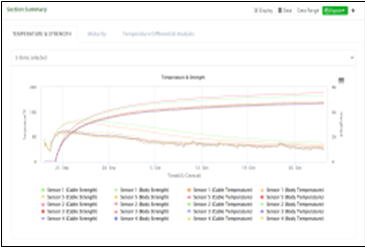
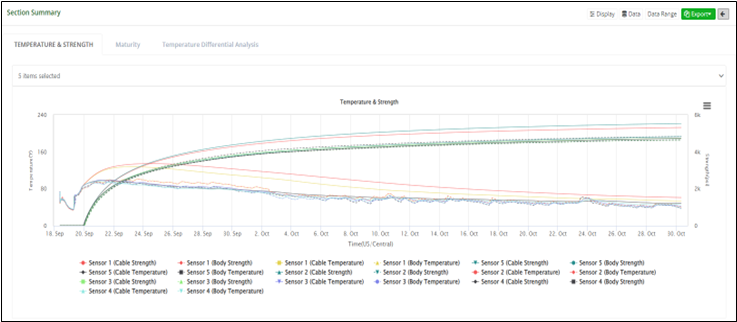
Unlike the app, the 360 dashboard offers the option to select multiple sensors within a section simultaneously using the drop-down menu available. Selecting 5 sensors, for example, will prompt the 360 to generate a combined graphical view of all the temperature and strength data of those sensors in a single chart. It can also apply to maturity. This gives the user the capability to compare the data recorded by different sensors and see how the data monitored differs from one another altogether at a time.
Specific Data Selections
A user can make further selections in the chart as in selection or un-selection of specific data as displayed in the image below.
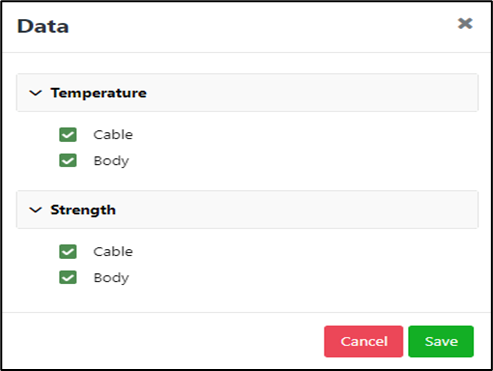
If the user decides to remove the body temperature of the sensor from the report being generated, they can unselect the body temperature from the selection box and save it as a preference. Once set, all the changes will be reflected when the user exports the report in PDF.
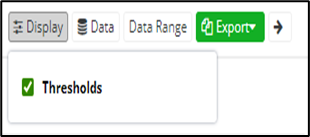
Likewise, these selections can also be made for the thresholds assigned. If a user decides to create a threshold limit, assign it to the sensor, and monitor when the limits are being achieved, these limits will be represented on the temperature profile chart in red and blue lines. This might not be beneficial for some users, which is why the 360 has a function called ‘Display’ selection. The user can manually select this option if they want the ‘Threshold’ to display on the chart or not.
The Bigger the Better – Try Expanding the Chart to Locate Data Points Easily
The user has successfully installed the sensors! They are working just fine, it’s been a few weeks already, and there are plenty of data points monitored. During the process, the user may need to interpret data points on a particular date or time. In such cases, locating and viewing each data point individually on a chart may be a tedious task. Thankfully, the 360 offers the option to expand the charts and view them on a more enlarged view.
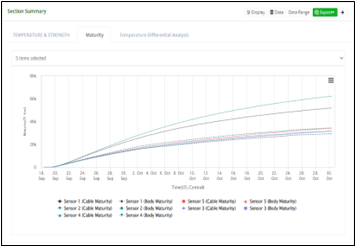
Maturity Reports
Calculating the maturity of the concrete is crucial for project success. It helps the construction teams know when their concrete has reached adequate strength and affects the sequence of construction operations. The mix creation can be performed in just a few steps using the SmartRock app and Giatec 360.
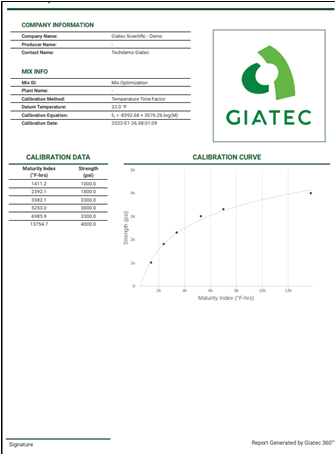
But when it comes to the report, it is important to be clear, precise, and concise. That’s exactly how the mix ID reports are created using the Giatec 360 dashboard. The report generated will contain the company logo, signature fields, the maturity-strength table, and the calibration curve. This can be generated just at the click of the ‘Export’ button.
Procore Integration
Widely used in the construction industry, Procore is a construction management software that allows users to collaborate on projects and share access to documents, planning systems, and data. For the several companies that use Procore, Giatec 360 offers the chance for integration. When Procore is integrated with the 360 dashboards, the reports can be saved directly under Procore. This feature allows the user to seamlessly save the reports under an integrated platform of Procore & 360.
Time to Look at the Reports!
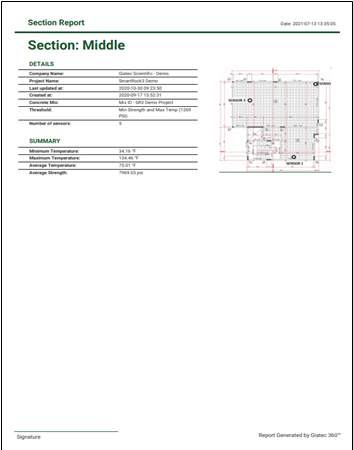
Below is an example of what a complete PDF report looks like for an individual sensor. A user can also generate combined reports for ‘n’ number of sensors together at a time by making the specific selections. These reports can be generated as many times as a user wants within a matter of seconds.
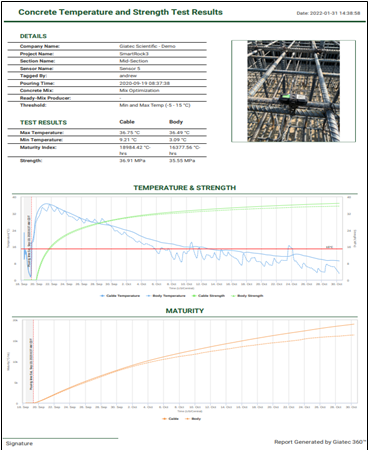
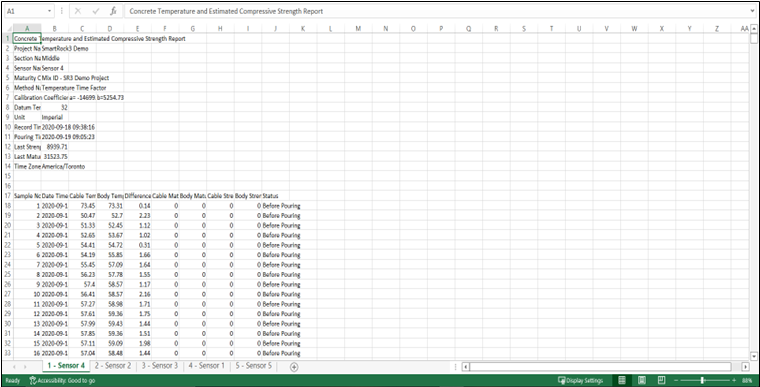
The PDF report is very comprehensive. We also have Excel reports for interpreting individual data points recorded, such as the temperature, strength, or maturity!
Similar to the PDF report, an Excel report can also be exported combined for the ‘n’ number of sensors within a section. In a combined Excel report, datasheets for each sensor are available. This allows the user to have access to the individual data points recorded. A user can easily navigate among these data sheets, interpret specific data points, and find the status of the pouring date and time.
So, How Can You Make the Giatec 360 Yours?
In general, the Giatec 360 has two plans: Basic and Premium.
The Basic Plan is limited and allows users to perform functions, such as:
- Manage users
- View Project Names and Assign them to Users
- Role-based access control
On the other hand, the Premium Plan allows users to have access to all the features outlined above and a lot more. Whenever a new feature is released, premium users will have first access. The premium plan comes with a 3-month free trial initially during which a user can access all the features for free. During this trial period, all the users of the company account will have complete access to the account. They will additionally have the opportunity to try out all the premium features.
Give your reports a new look! With the well-systemized Giatec 360, generate reports faster, smarter, and more economically.
To learn about the SmartRock sensors, visit: https://www.giatecscientific.com/products/concrete-sensors/smartrock-maturity-meter/
References: